Visualizing Vaccine Data
Merck
CHALLENGE
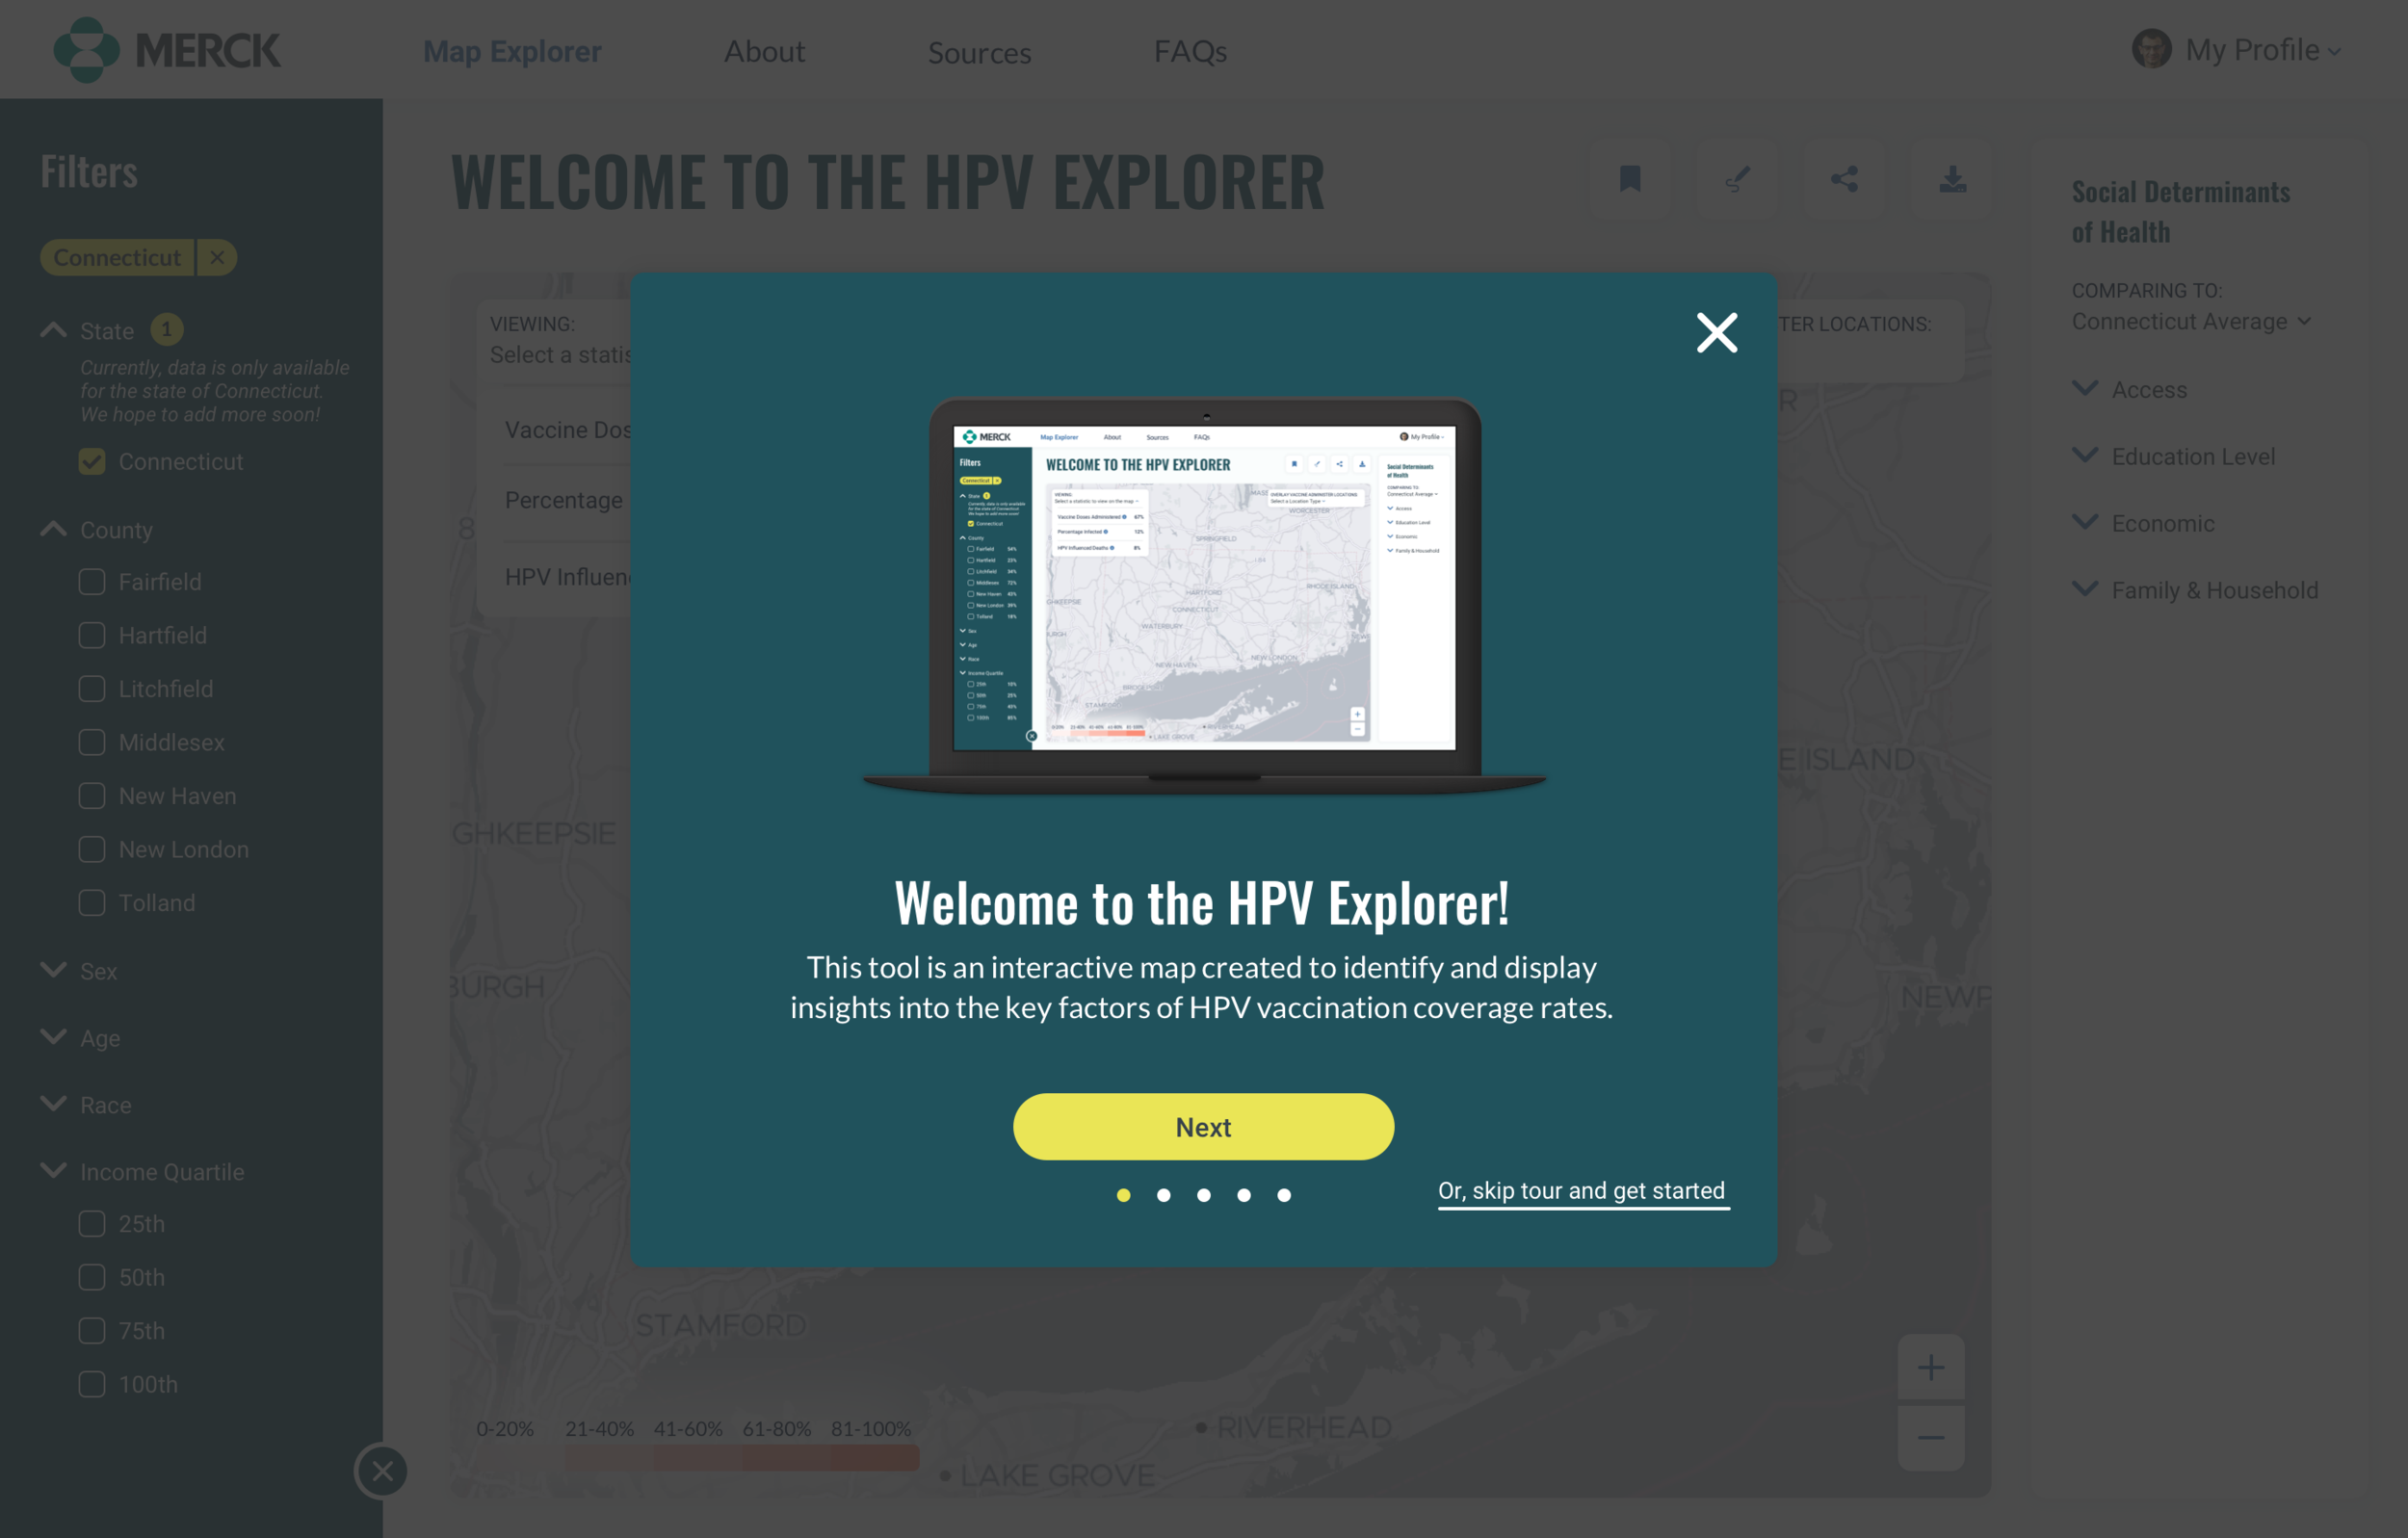
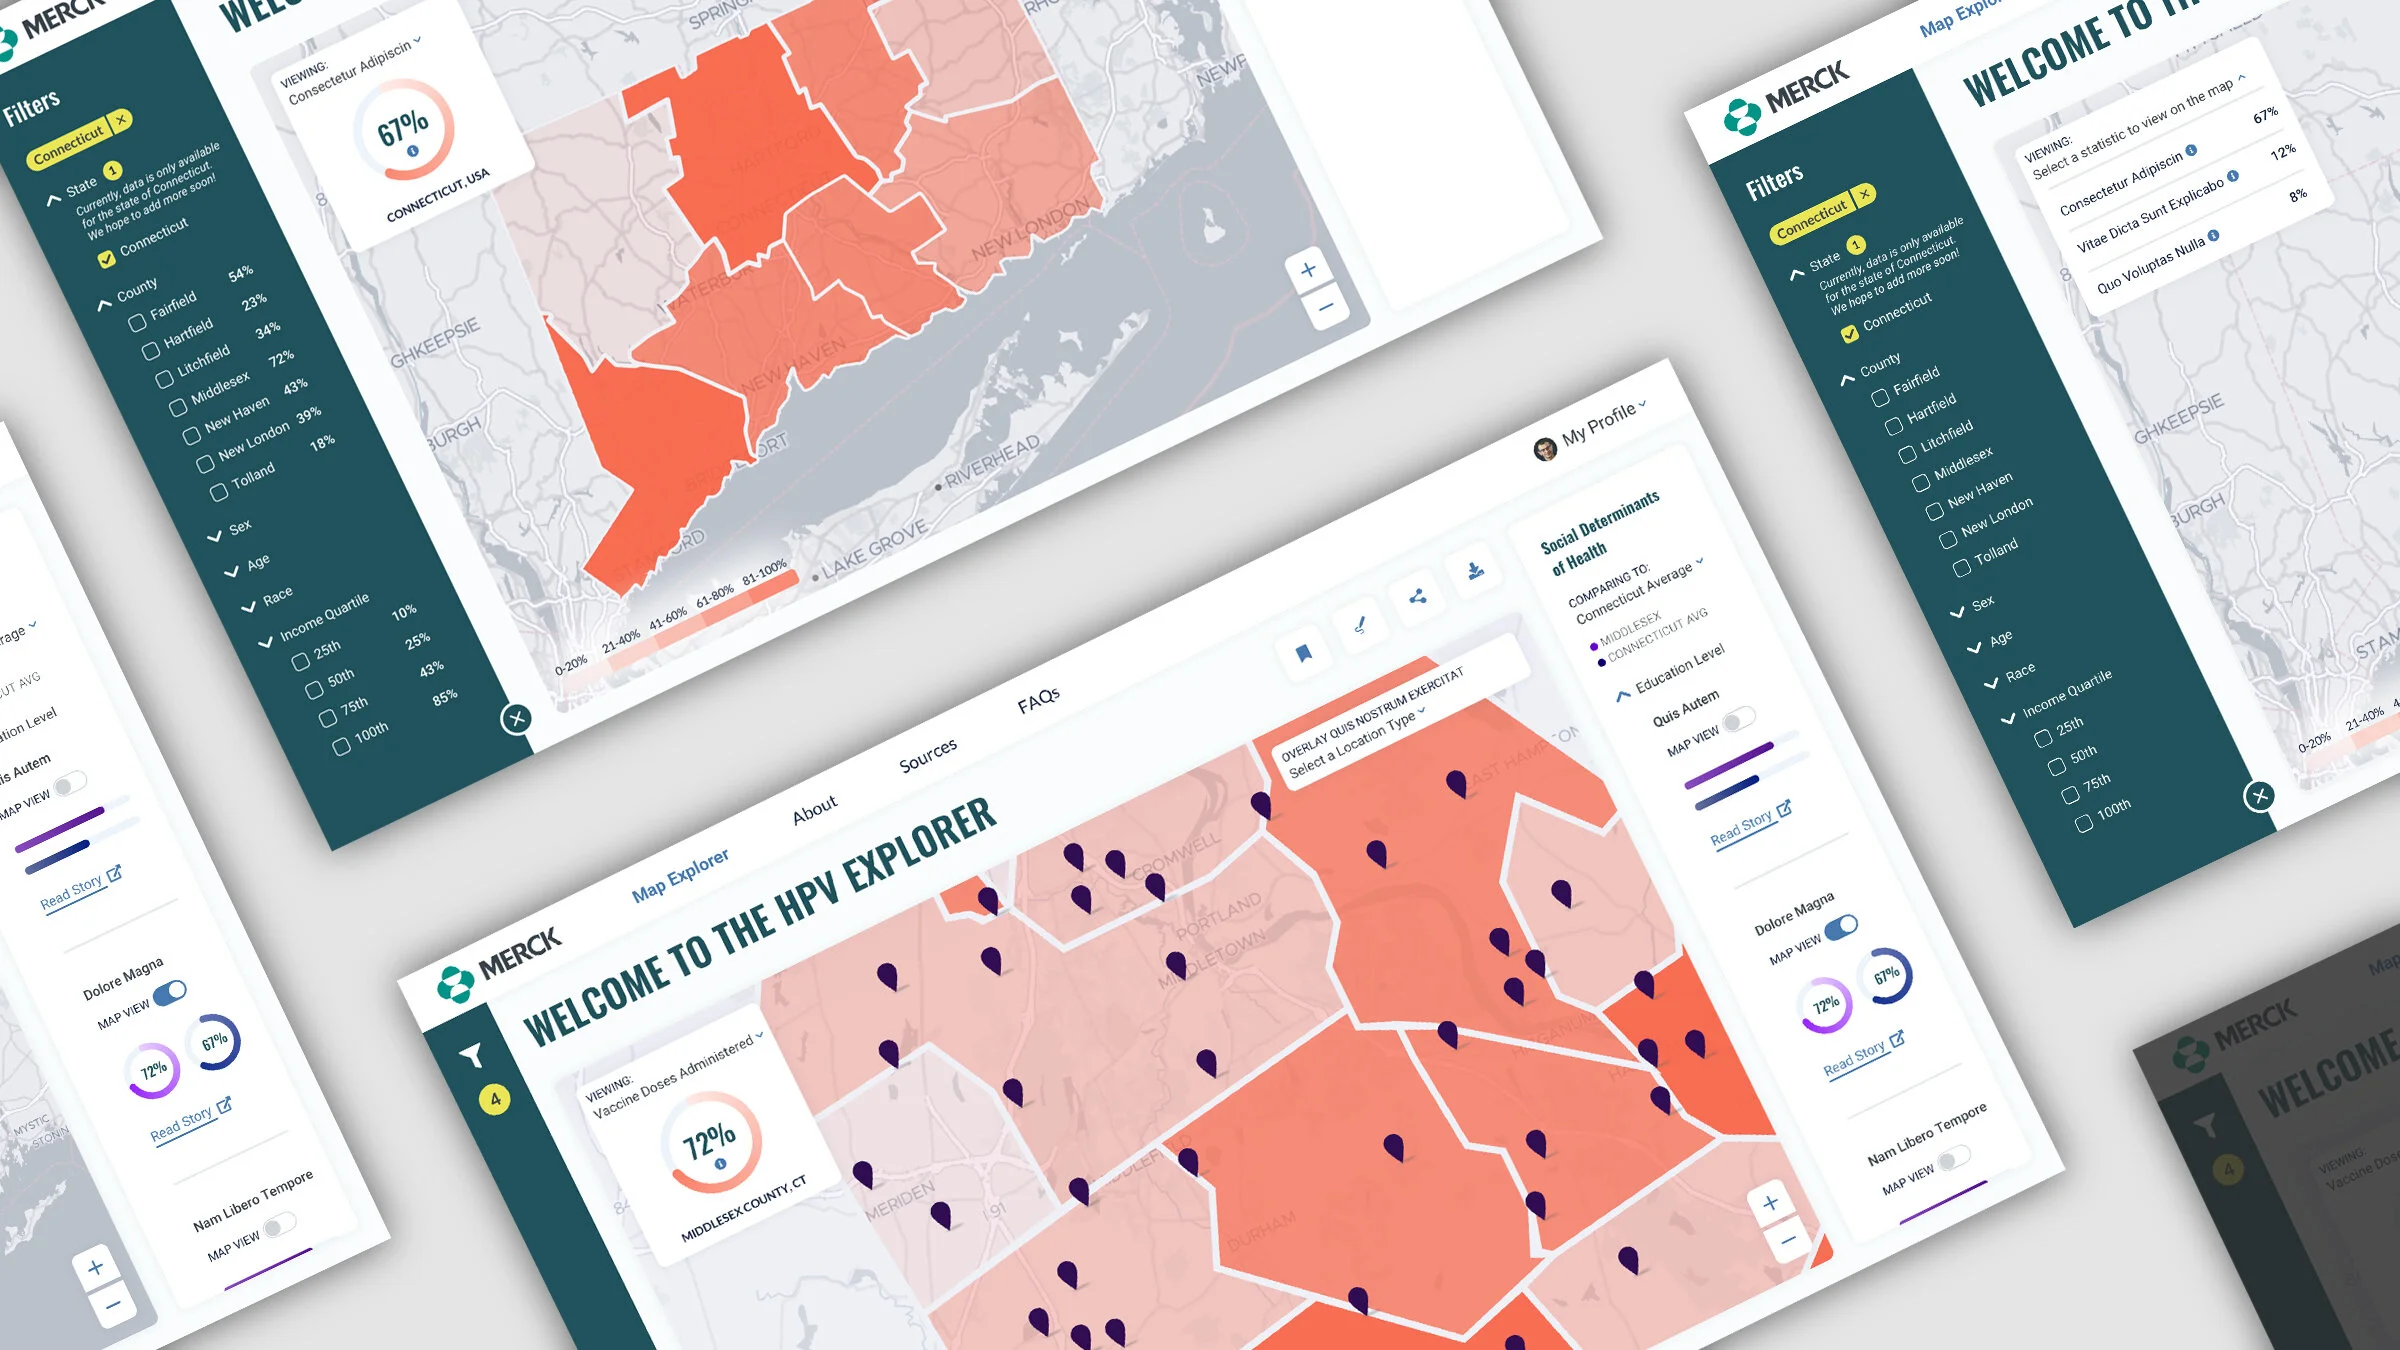
Merck had a problem: what was the reason behind low HPV vaccination rates? Our data and analytics team created a dashboard pilot program that utilized Geographic Information Systems to map traditional and non-traditional HPV vaccination administering locations. But they needed my teams design support to take their solution another step further by identifying other key uses of the tool for the scientific as well as sales marketing teams. In addition to locating vaccination sites, we wanted to identify key social determinants of health that influenced HPV vaccination coverage rates to provide additional insights.
SOLUTION
We conducted discovery research via user and stakeholder interviews to understand diverse use cases across Merck’s HPV organization. This qualitative research helped identify goals, data needs and challenges, which were used to inform user personas and user stories.
We created wireframes and high fidelity prototypes focused on addressing the most pressing and overarching needs of all users, and through rounds of user testing, we identified key areas for improvement.
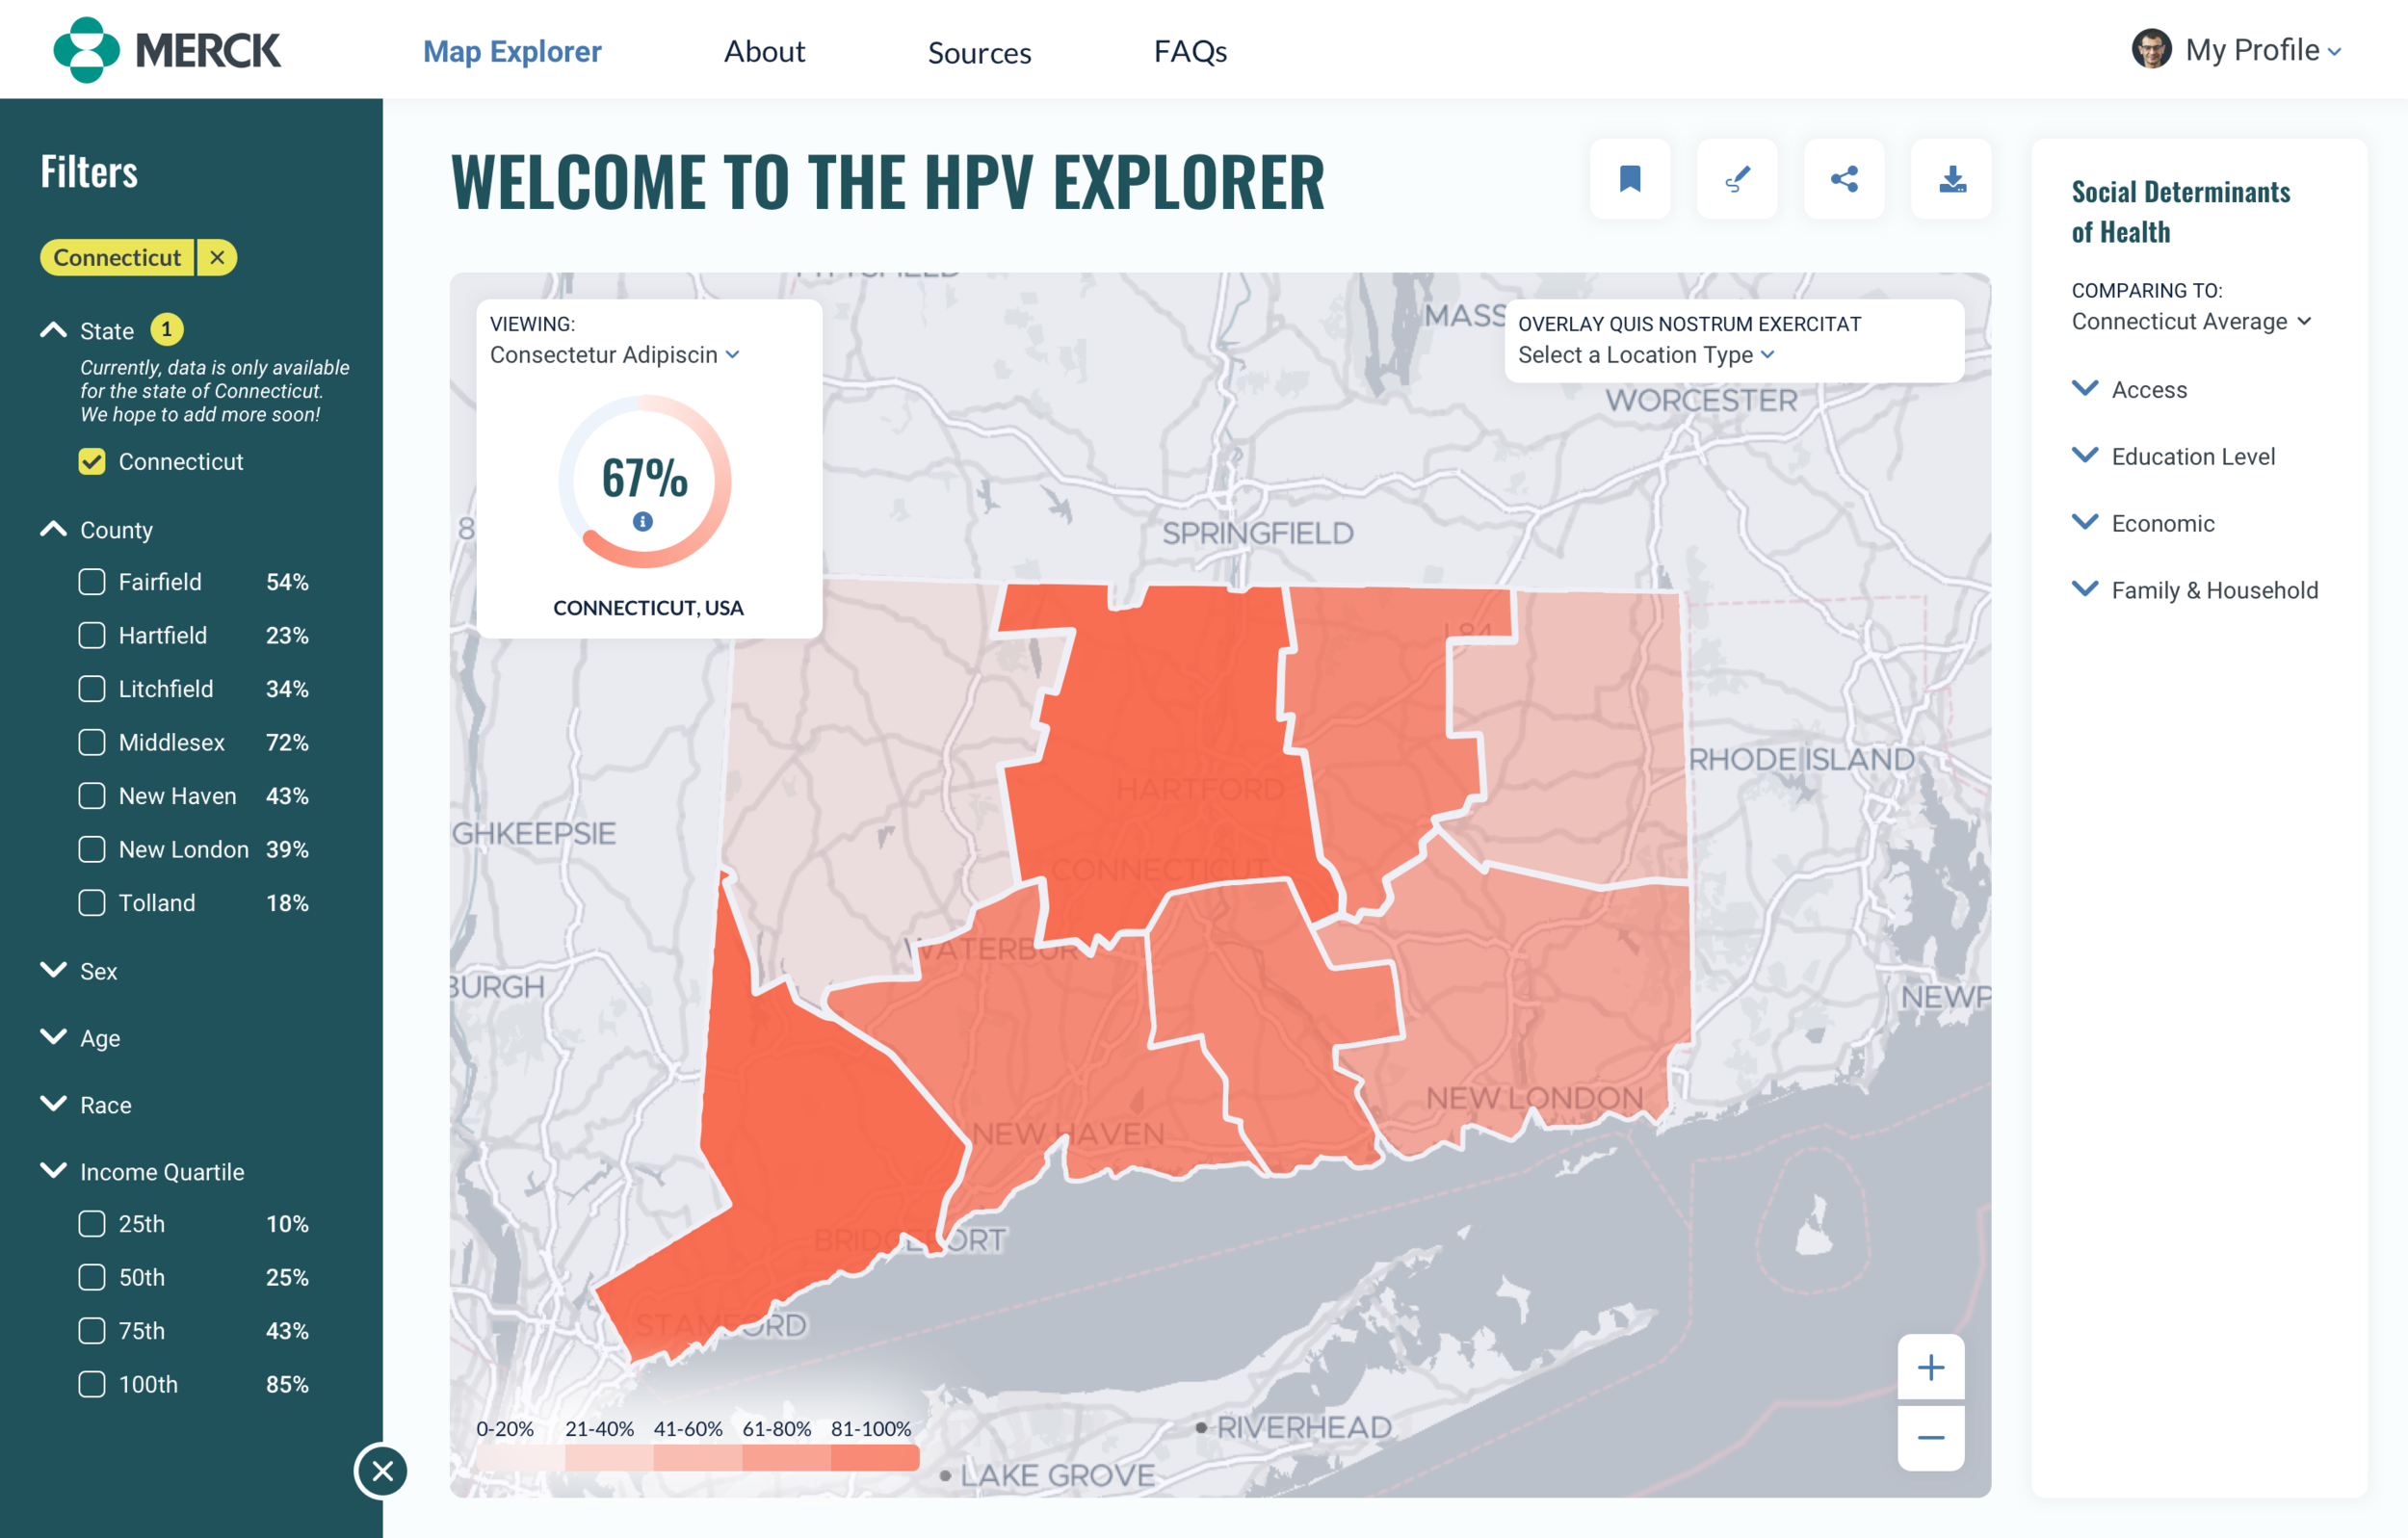
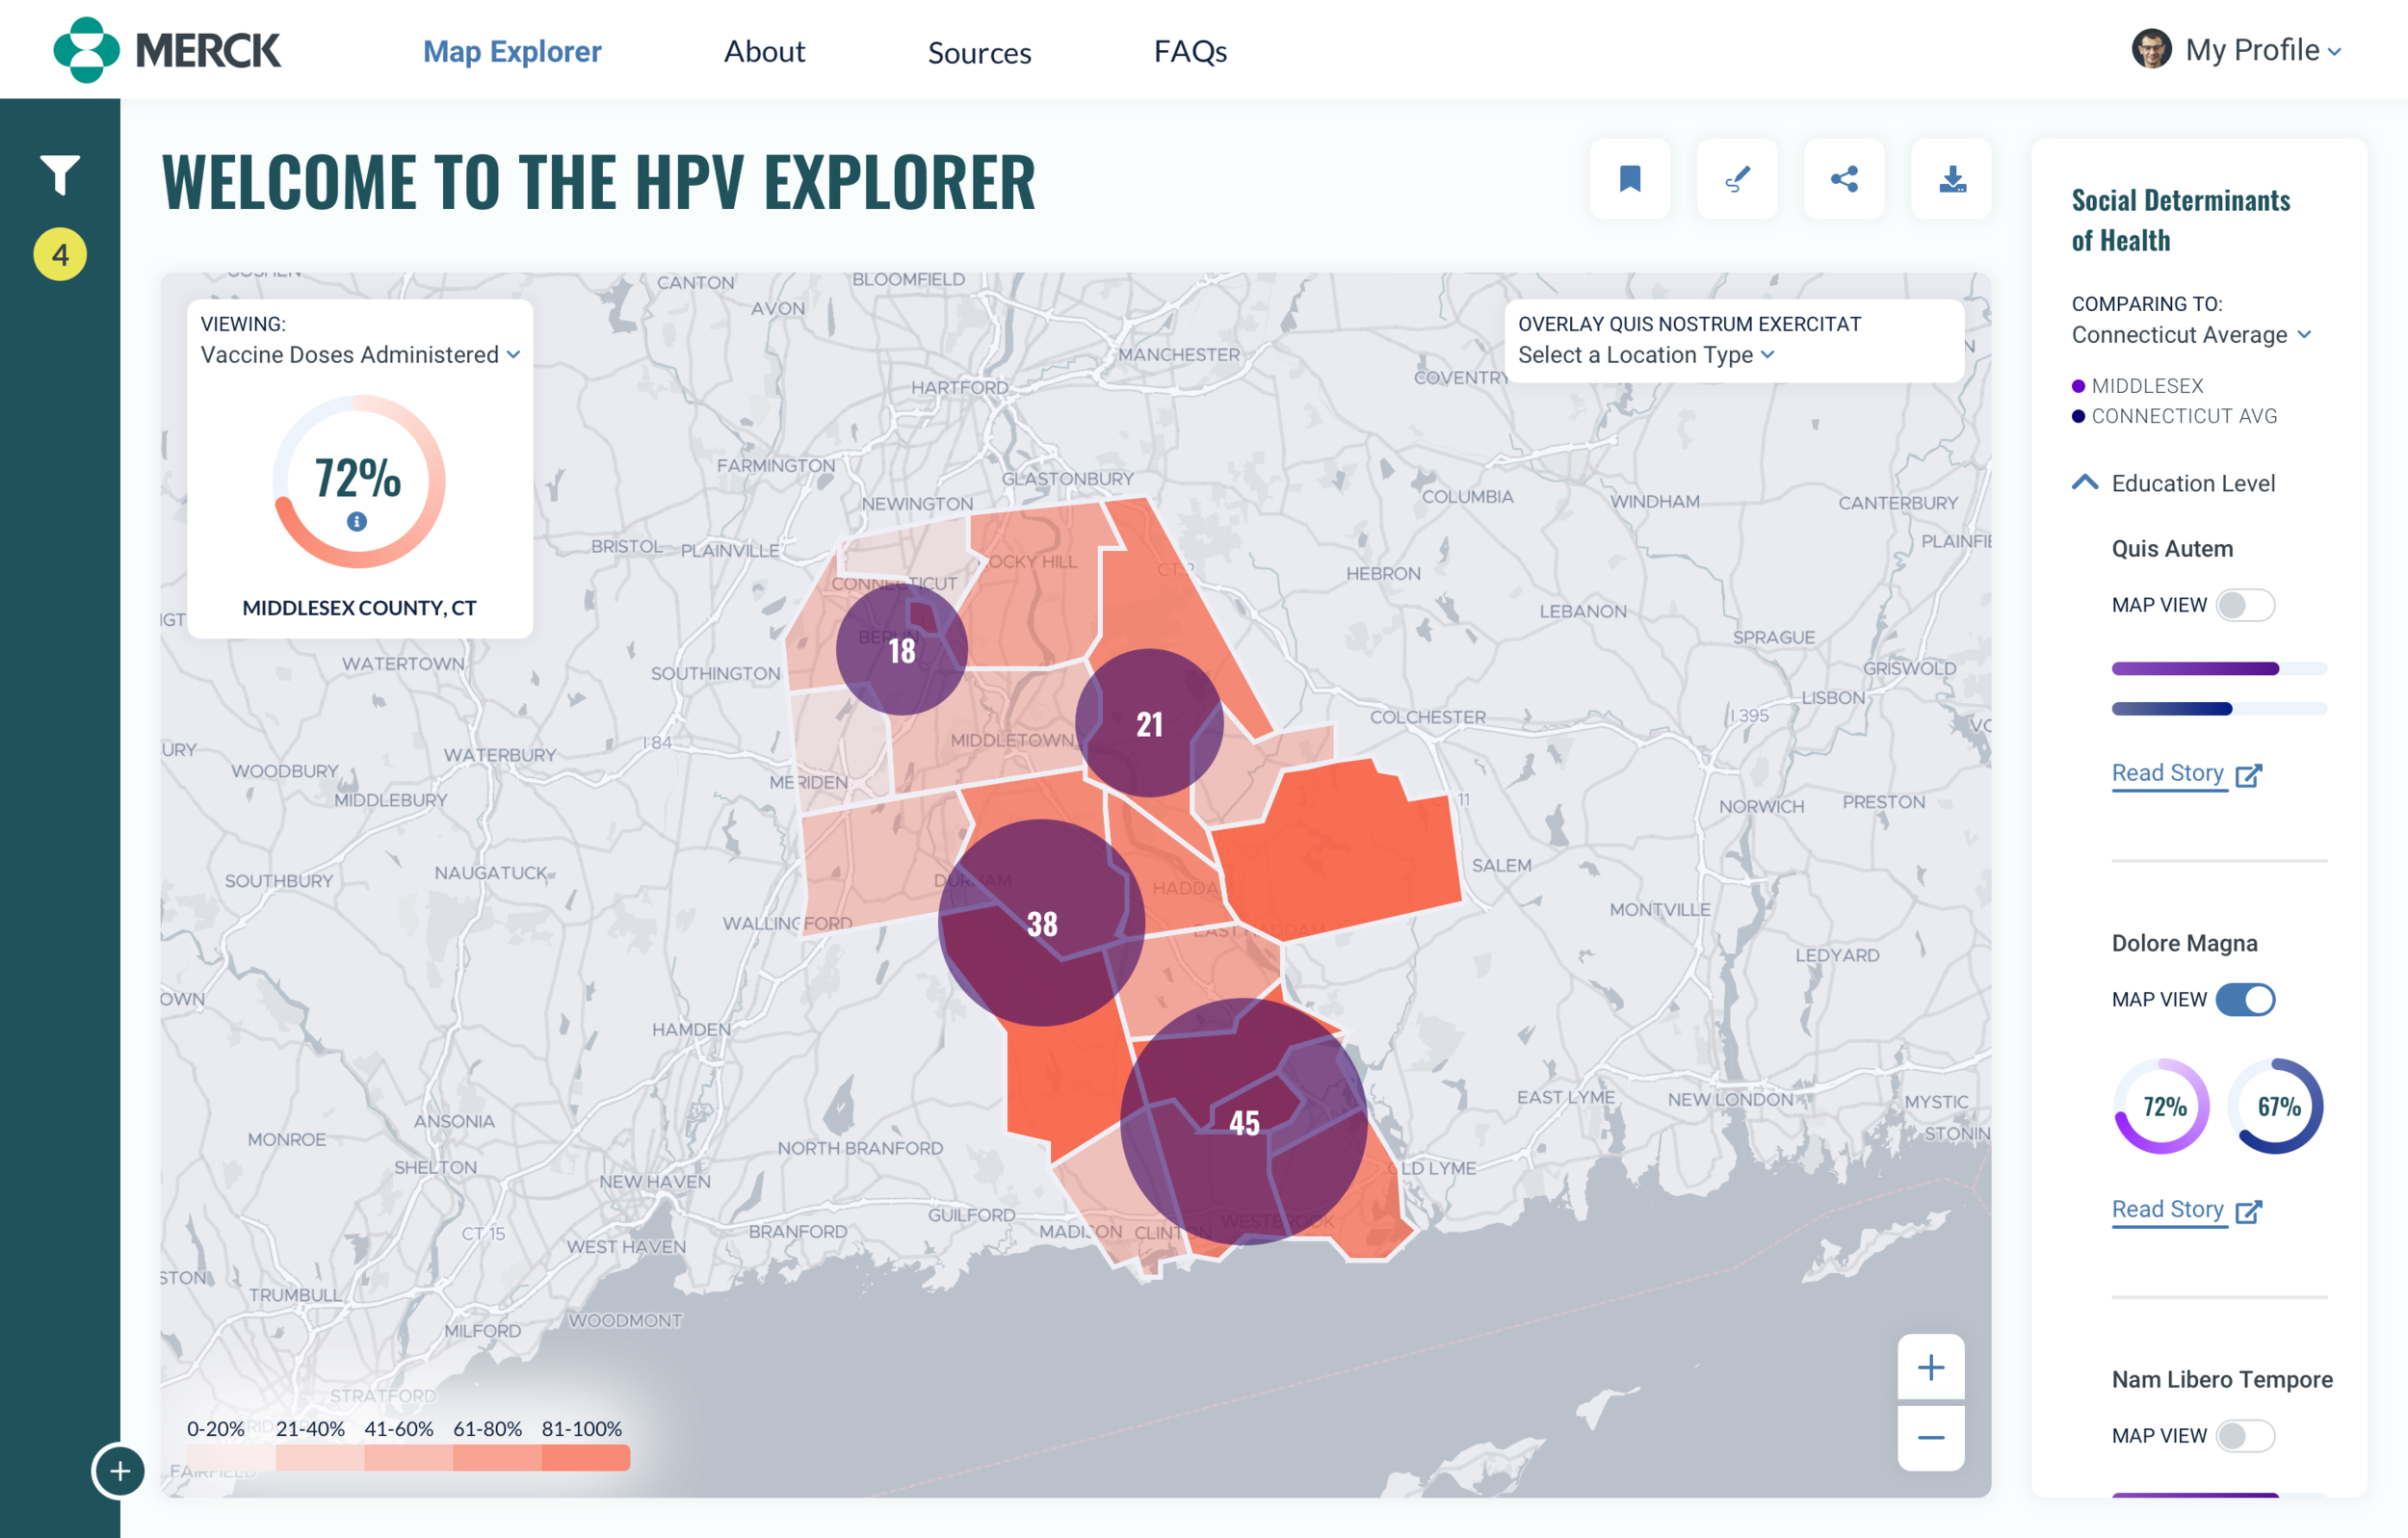
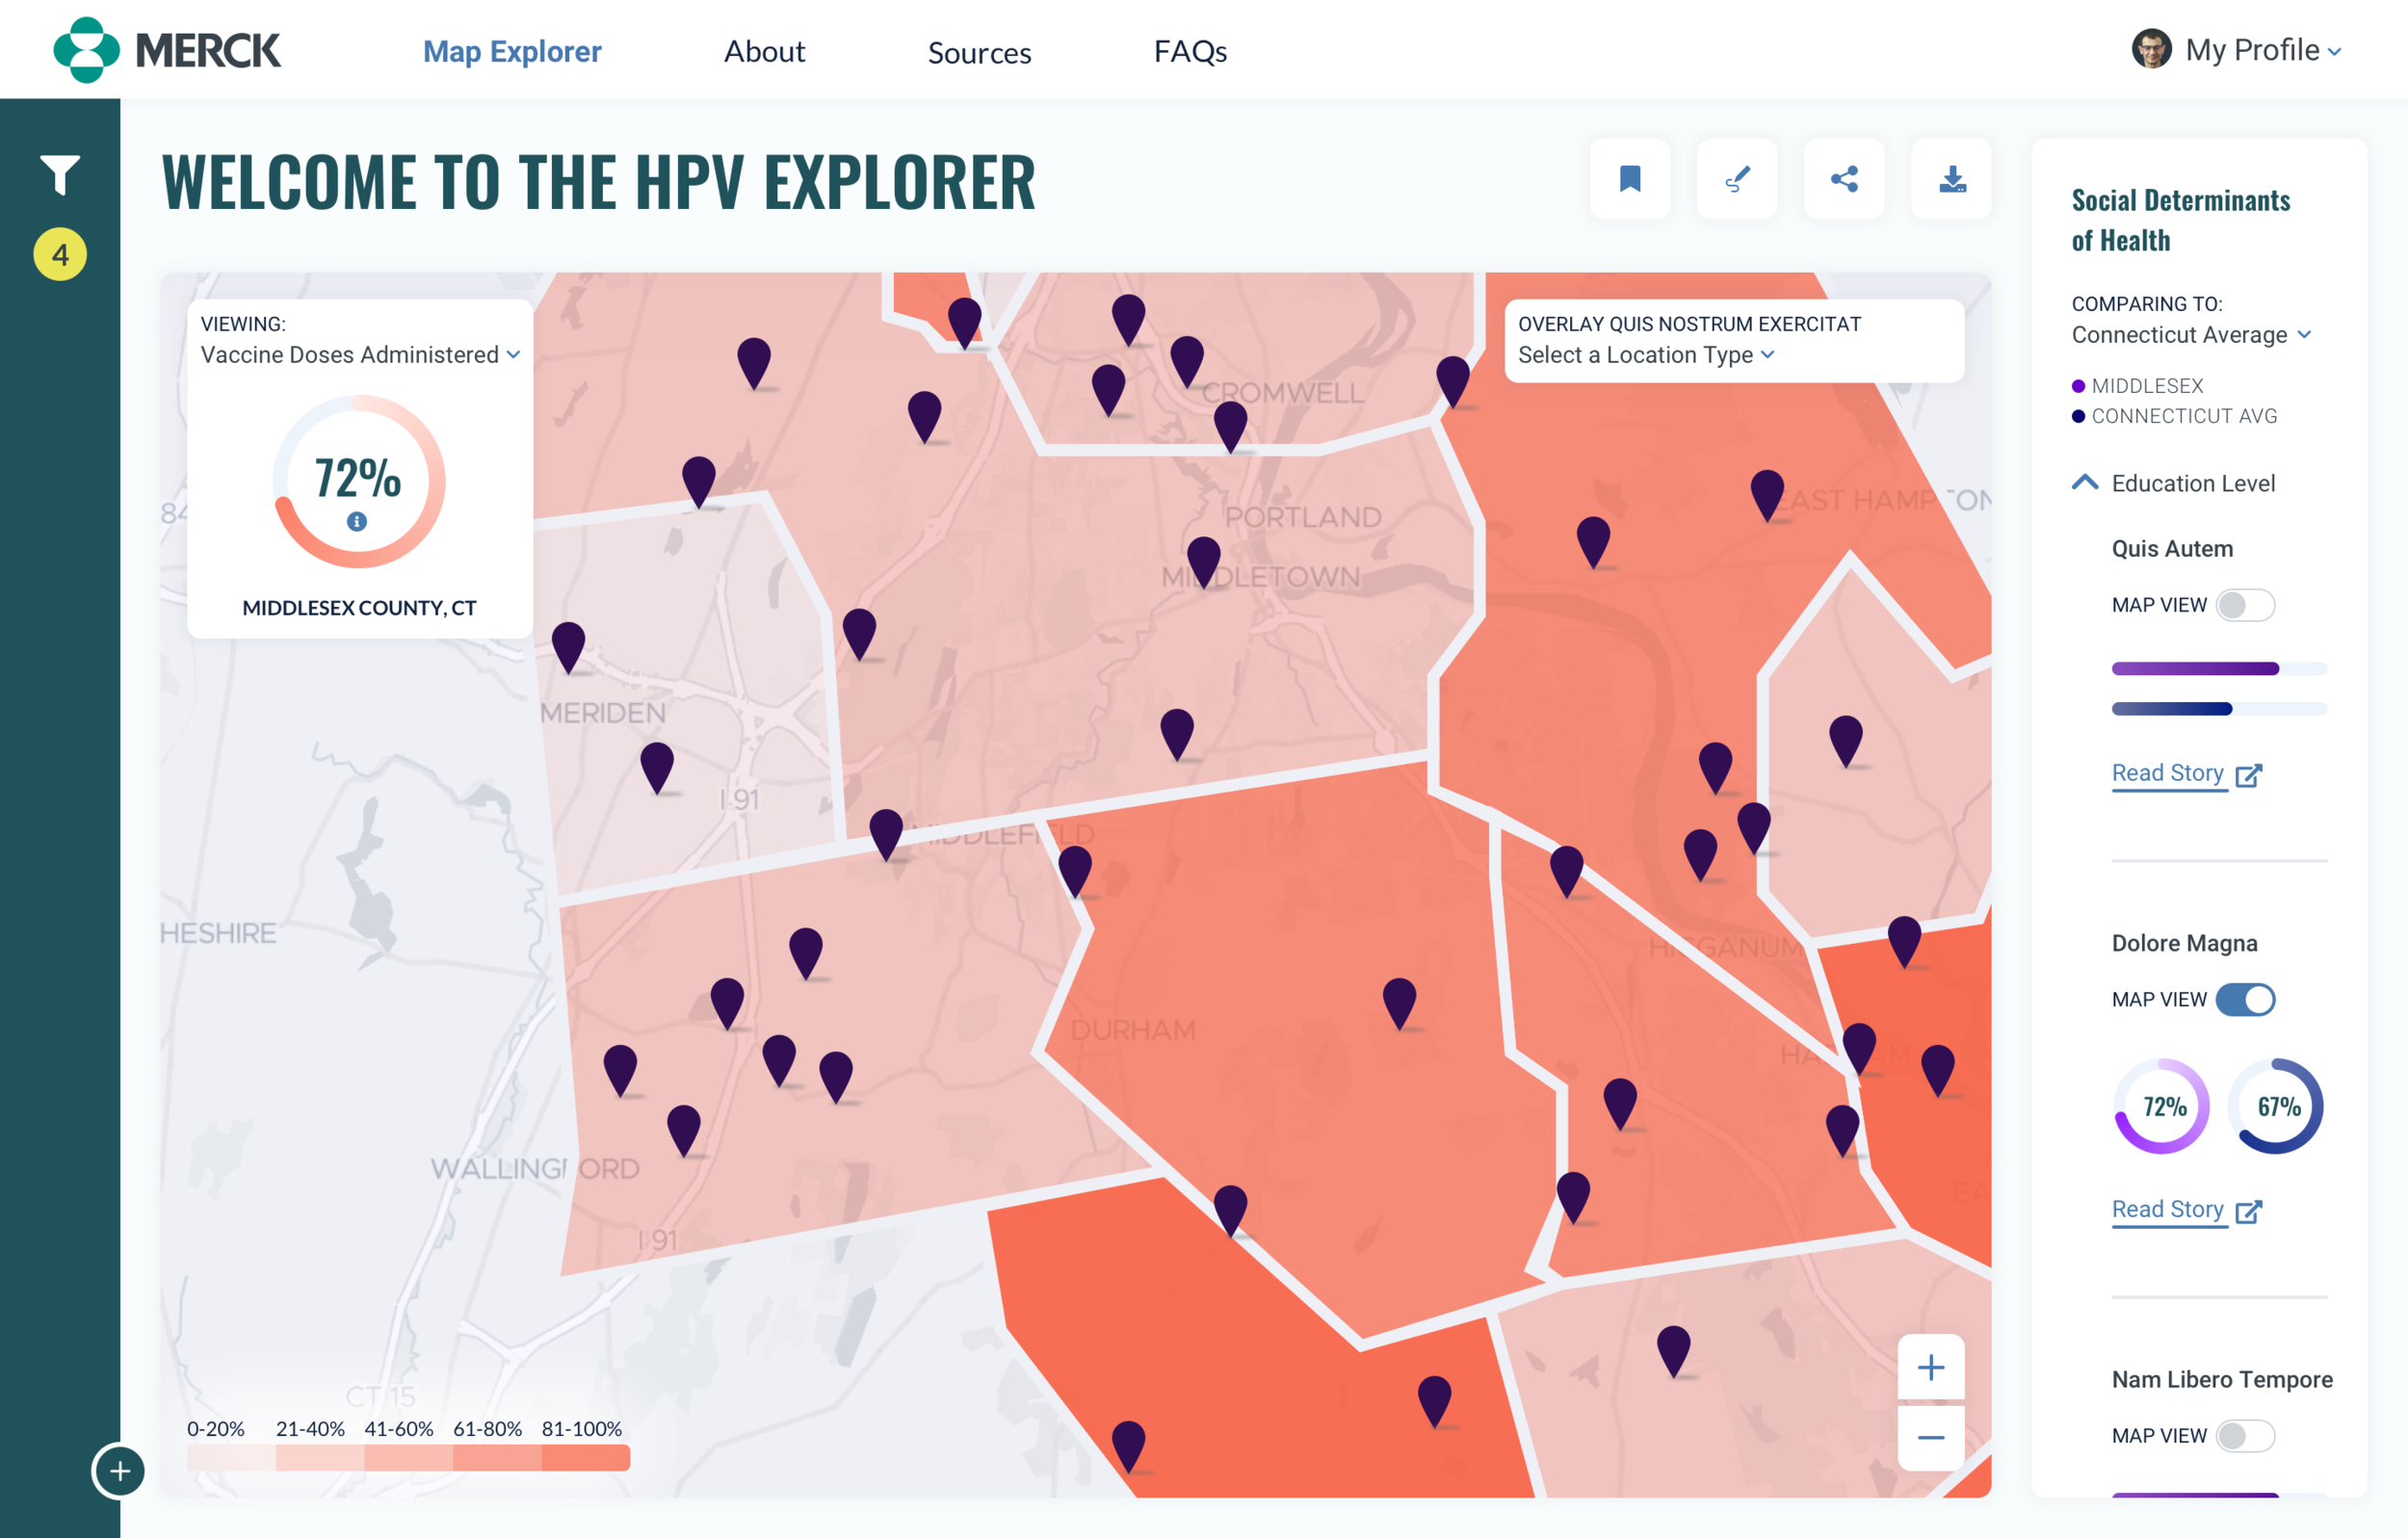
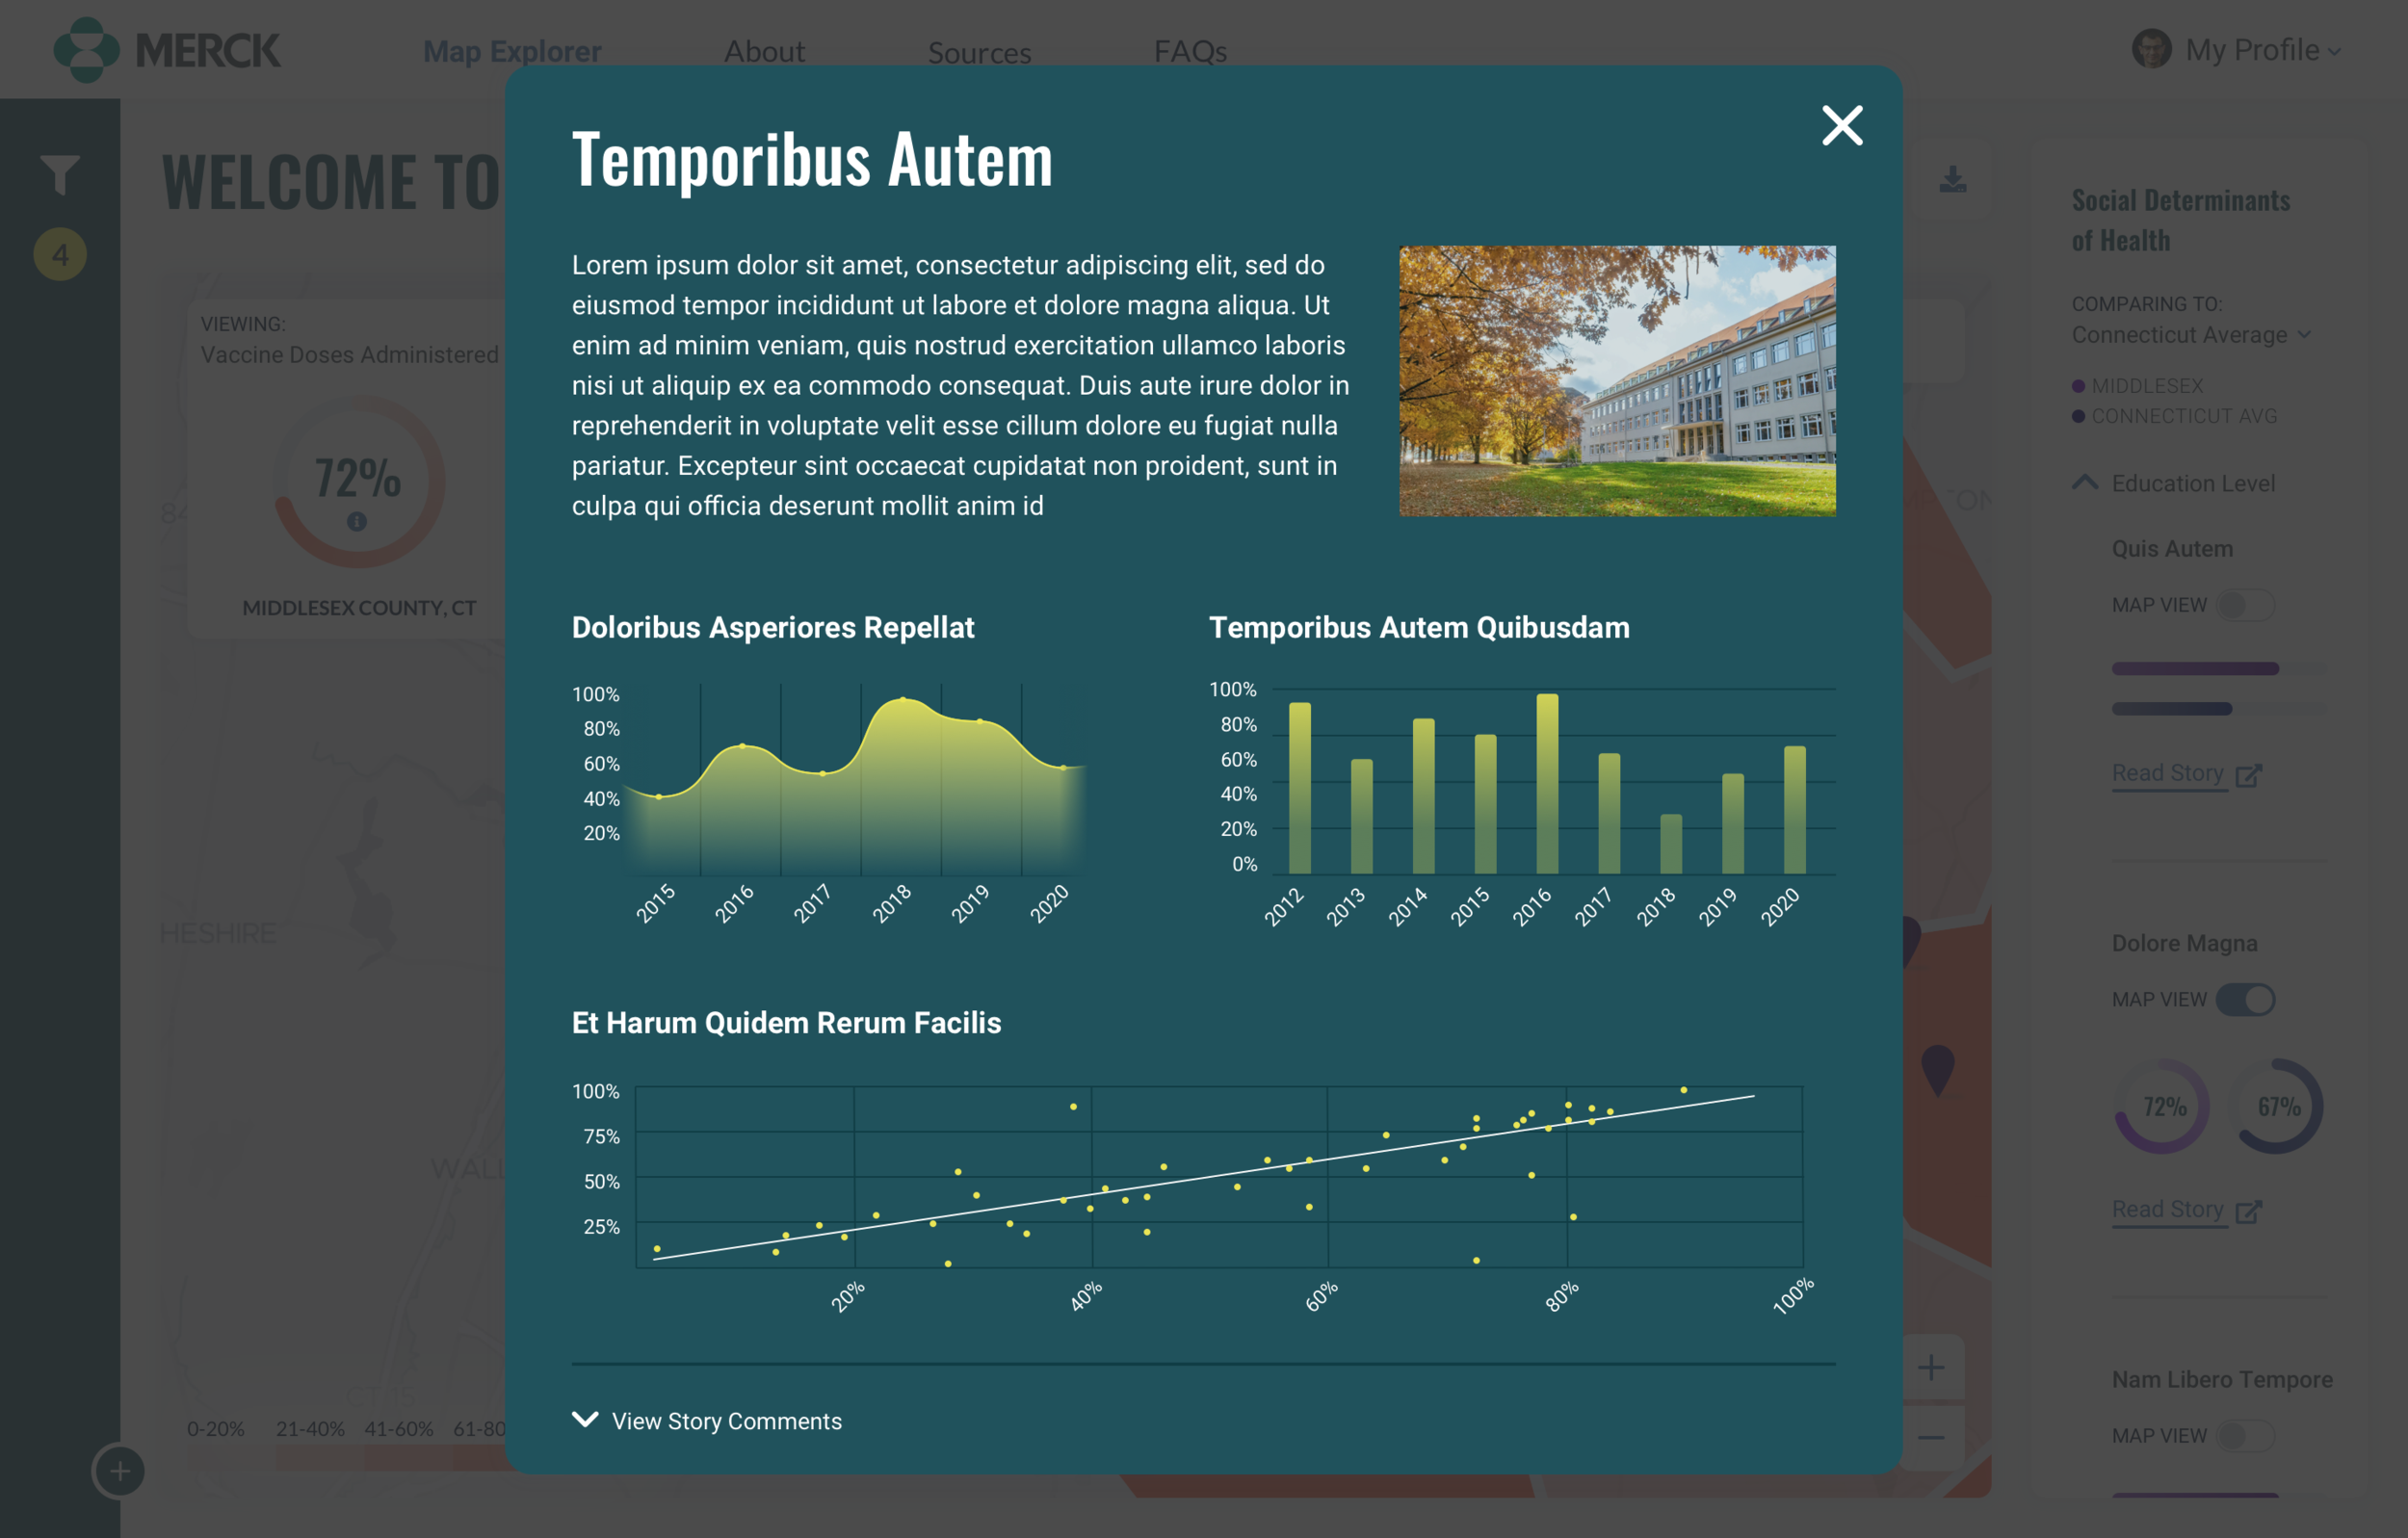
The final deliverable was an interactive, data-driven platform that allowed for the visualization and cross examination of multiple sets of key HPV vaccination data points from both a large-scale state and county view as well as a highly detailed census tract specific view. The ability to map HPV vaccination coverage rates and layer data relating to social determinants of health (ex: school enrollment rates, access to healthcare or income level) allowed users to identify key geographic regions for targeted improvement and better form hypotheses that spurred further research around vaccination rates.
CONTRIBUTIONS
Conducted virtual design thinking workshops
Performed user interviews and user acceptance testing
Provided creative direction for wireframes and interactive prototype